At this stage of my project, I have immersed myself in reading articles and blogs on game design, particularly the writings of academics who use Twine to teach history. I have also spent time watching videos on designing Twine games. Additionally, I have identified and played several Twine games, including Ponce’s Surviving History: The Fever! and Quinn’s Depression Quest, for game design ideas.
I need to learn more about Twine’s technical parameters. I have discovered that the images used in my game must be web-based. I want to learn more about specific site locations to identify publicly accessible visual sources for my game. I need to research more about the day-to-day lives of African Americans living on the Main Line.
Most of the primary sources I am finding are in Black church archives and the homes of long-time Black Main Line residents. I am also meeting with long-time Black residents willing to share their memories of living on the Black Main Line.
I plan to use a publicly available 1926 fire map of South Ardmore, along with AI-generated images of people and some primary sources from Main Line Black church archives. I am interested in seeing examples of game design workflows mapped out, but I am not certain where to find any to review. Time playing on Twine has been the biggest challenge I am experiencing. My next steps include drafting the game scenario flow for my Twine game.
This 1926 G. W. Bromley and Co. fire map captures South Ardmore, the area where African Americans were concentrated.
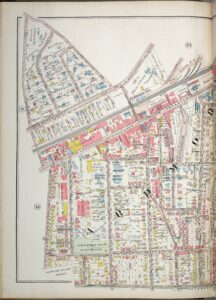
I am including a map in my project because, as a representation of space, maps do not just reflect the reality of a location; they create it (Seager). This map is one of many produced by companies for insurance companies to assess property risks. Maps like this documented a town’s physical structures, including businesses and homes, all by address and, for homes, by the homeowner’s name.
I will provide contextual information about the map for my audience, including the map’s creator, year of creation, and reason for its creation. I will help the intended audience analyze this source by identifying the names of the four streets where African Americans were primarily concentrated and the number of African American families living on these streets.
This historic map documents the history of African Americans in this section of Ardmore by identifying the names and locations of its three houses of worship and York Nelson’s homeownership, which belonged to one of the town’s most influential community members. It also shows the proximity of these locations and provides viewers with insight into how residents in Ardmore’s Black community might have navigated living in their enclave while navigating the town’s geographical boundaries in relation to other institutions, including Haverford College and the Auto Car manufacturing company.