How do we translate the monumental legacy of five Historically Black Colleges and Universities (HBCUs), each with rich archival collections, into a digital landscape? In my review, I explore “At the Vanguard: Making and Saving History at HBCUs,” a dual-format exhibit on display at the National Museum of African American History and Culture. By comparing the physical and digital experiences of five landmark institutions, Florida A&M University, Tuskegee University, Texas Southern University, Clark Atlanta University, and Jackson State University, this analysis dives into the power of “generous interfaces.” Discover how thoughtful digital design can transform massive cultural collections into immersive, navigable journeys that invite visitors to do more than just look, but to truly browse with intention.
All posts by admin
Mapping the Black Main Line, 1900-1950
“Mapping the Black Main Line, 1900-1950”
Pennsylvania’s Main Line is known best as a bastion of “Old Money” wealth and stately mansions. However, little attention is given to its once- thriving independent Black communities, which are currently under threat from gentrification. My project, “Mapping the Black Main Line”, is a digital mapping initiative that uncovers the people, places, events, and institutions that shaped the Black communities on the Main Line from 1900 to 1950, and illustrates how these communities helped to shape the Main Line.
My project aims to provide an important counter-narrative to the prevailing historical accounts that depict the presence of Black communities on the Main Line as limited to roles of servitude for wealthy White families. While historical evidence indicates that some African Americans were employed as domestic workers on large estates, it also supports the existence of thriving, independent Black communities, particularly in Ardmore, Bryn Mawr, and Haverford, that flourished along the Main Line corridor. This project reframes these Black communities as a central, agentic force in the development of the Main Line. Additionally, this project addresses issues of cultural erasure, as some of the places central to Black communities on the Main Line no longer exist or are at risk due to current and future development plans.
The history questions my project aims to answer include identifying lesser-known but significant Black Main Line residents who shaped their communities. What were some of the earliest social and cultural institutions formed by Main Line Black communities? How did Black communities financially thrive during their development? How did the Main Line’s Black communities contribute to major U.S. historical events, including the Great Depression, WWI, and WWII? What were some of the Black-owned businesses that contributed to the growth and sustainability of Black communities?
My research will utilize historical maps of residential and business districts, archival photographs, and newspaper records from historic Black churches and Main Line institutions.
I will focus on historical maps that depict residential, social, and business locations, as well as archival photos of Black Main Line people and places. This project will also include archival newspaper articles from the Main Line press and the Philadelphia Tribune. I also plan to incorporate secondary sources in my project. For the project design, I will use ArcGIS mapping software and Omeka, drawing on the Histories of the National Mall project (Brennan, 2015).
The primary audiences for my project include Black communities on the Main Line and the broader Main Line, Philadelphia, and Delaware Valley regions. Educators and students in these areas are also considered primary users of the project. Secondary audiences will include tourists to the Philadelphia region, Pennsylvania history enthusiasts, and individuals interested in African American history. The project aims to reach these audiences through its design and mobile optimization, since there is no single physical location. Looking ahead, I am considering using augmented reality elements at some of the featured sites, which could, with the help of AI-generated tools, bring history to life during walking tours.
Personas

Name: Betty Taylor
Demographic data: 60-year-old, is a native of Philadelphia. She’s spent her career in the Philadelphia Public School System, first as a high school history teacher. She’s currently a Curriculum and Instruction Administrator with the district’s central office.
Descriptive Title: Master Practitioner
Quote: “Our students are our future, and by God’s grace, I will make sure they are ready.”
Day in the Life: Betty’s days usually start with a cup of tea and prayer, followed by a light breakfast. After petting her cat, Koko, Betty makes her 30-minute commute to the School District’s central office, where she’ll spend at least ten hours a day. Betty has moderate computer skills. Betty’s days start with a quick check-in at the central secretary’s office to get a heads-up on what is happening. Afterwards, she heads to her office to check her voicemail and Outlook messages. Afterwards, there is usually a series of phone or Zoom meetings with other district administrators.
By midday, Betty eats lunch in her office and shifts to preparing for her afternoon on-site meetings with a core team of teachers on curriculum and a long-term curriculum plan, using digital tools to engage students. Betty navigates her office tools, including her computer and phone system, well, but gets frustrated when she needs to rely on staff for help. She gets particularly frustrated when the technology “gets in the way” of her work because she knows she’s good at what she does and doesn’t want to look inept in front of her peers and subordinates. She enjoys learning new tricks for student learning, but doesn’t want her time wasted on “figuring out how it works”. By the end of the long day, Betty is ready to head home. She prays daily for grace and patience as she figures this out for her students’ sake.
Betty’s goal is to provide new learning resources to support student engagement with instructional content. Betty is a woman of faith with a deep love of the Philadelphia region and Black history, especially the history of Black churches. She is committed to helping her students appreciate Philadelphia’s historical significance and the contributions of African Americans. Her team is also hoping to use district funds to blend digital tools with more field trips to local historical sites to support student learning.
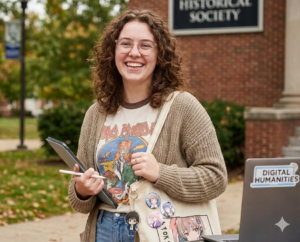
Name: Katy Hill
Demographic data: Katy is a 20-year-old Midwest transplant and junior double-majoring in History and Environmental Studies, an homage to her Popop. She attends a small, private, liberal arts college in the Philly suburbs. She’s a self-described “anime geek” and lover of history and all things digital.
She enjoys her part-time job in the local Black community near her college. Yet, she feels uncomfortable about the disconnect between what she learns about this area in her Environmental History class and what she observes during her visits. She wants to bridge this gap, yet she is mindful to navigate carefully as a transplant.
Descriptive Title: Existential but caffeinated
Quote: “History is the environmental data of the past.”
Day in the Life: Katy is usually out of her dorm room by 7:15 am, gripping her reusable coffee mug, which she fills at the dining hall with a double-shot oat milk latte, and heads to her early morning classes, her preference so she can use her afternoons and evenings for her part-time job and research. Her classes are over by 2:00 pm, and she’s back at the dining hall for her favorite quinoa bowl, which she enjoys glued to her MacBook and phone, checking emails and Facetiming family and friends. By late afternoon, Katy’s in the college library doing homework and research until it closes at 10:00 pm. During the week, Katy spends most of her spare time visiting local historical societies, in her college’s dusty archives, and searching through databases.
Katy’s goals: She is curious about this community’s formation, its geographical boundaries, how they have changed over time, and the history of its institutions and founding members. If this information were accessible through a digital project, all the better. She would even like the opportunity to help the community contribute to an existing project as an act of restorative justice.
Digital Public History Blog Post 1
Wineburg’s article resonated with me because of our shared experiences and frustrations in educating young people. In relation to digital humanities, Wineburg highlights a significant point on the disconnect between what historians do, bring the past to life, by “thinking historically”, vs what young people think historians do, “just memorize facts and stuff”. This disconnect raises important epistemological issues regarding how historical knowledge is generated and transmitted, as well as practical questions about how public historians can play a role in both processes.
In this digital age, these concerns intensify as younger generations, our future citizens and leaders, and perhaps historians, increasingly rely on digitally generated content, content that is often not interrogated and accepted as fact. Training the next wave of citizens starts now by teaching young people the process of “learning historically”. As Wineburg makes clear, this process reveals how historians think and how they achieve transparency in their work, thereby continuing to expand knowledge and solve the mysteries of historical records.
Additionally, this issue emphasizes the need for public historians to consider the public as the audience when designing future public history projects. Brennan et al.’s Building Histories on the Mall: A Guide to Creating a Digital Public History Project addresses these concerns using Brennan’s Histories of the Mall exhibit as a case study. Brennan et al.’s blue print speaks to the importance of designing projects that start with “sources and questions” that would guide the documents’ interpretation” Additionally, Brennan’s project speaks to the significance of using intentionality in designing digital public history projects so the projects are engaging, interactional, and make the past come to life so the public can even be inspired to do their own inquiry into the exhibit topic.
Brennan et al.’s reading offers an antidote to Wineburg’s concerns about how to teach young people to think historically, demonstrating the team’s intentionality in creating the Histories of the Mall project from inception through testing and evaluation. This approach also seemed to be the reason the project successfully provided users with engaging ways of accessing the histories of the people, places, and events that shaped the National Mall.
These two articles offer future public historians, like those of us in this class, food for thought and a blueprint for consideration. One of the questions that I have been considering, and I am sure I’m not alone, is how to methodically design my project with Wineburg’s concerns for making history come alive and Brennan’s level of intentionality in project design, so the public digs deeper and asks more questions.
(Re) Defining Digital Humanities
After reviewing my initial definition of digital humanities that I created at the start of this course, I would keep the core of my definition intact, including acknowledging the field’s intentional interdisciplinary approach that integrates humanistic inquiry with advanced research, digital methods, infrastructure, and tools to analyze, create, interpret, amplify, and disseminate knowledge about the human condition. My revised definition also maintains the idea that DH requires collaboration among scholars, cultural heritage professionals, technology experts, and community partners, as well as the public, to preserve, curate, and interpret cultural heritage collections. Additionally, my revised definition would also emphasize the DH team’s responsibility to acknowledge issues of access, equity, and intersectional power in the DH process and in the finished work. Finally, my revised definition would still acknowledge scholars who contributed to the foundation of this field, including Booth and Posner, Drucker, Owens, and Unsworth), and the shifting definitions of the field over time (Bobley, 2008; Ide & Mylonam, 2004; Schnapp & Presner, 2009).
After completing this course, I recognize the importance of revising several aspects of my definition, including the recognition that digitized materials are the basis of DH projects, often with terms of use restrictions (Abbott, 2015; Terras, 2012). In addition, my revised definition should provide examples of digital humanities projects that apply various field methods to recognize the evolving nature of the field. I would modify my definition to include examples of digital archives, network analysis, digital storytelling, data visualization, mapping, and audio storytelling, along with legacy humanities practices, such as oral history, because these examples can better illustrate the power of digital humanities to make cultural materials accessible, meaningful and discoverable. I would additionally include a statement that DH continues to evolve and redefine itself to promote public engagement. Finally, my revised definition would include the significance and benefits of crowdsourced expertise knowledge to advance DH projects, particularly given the availability of AI-generated content, which threatens to pollute historical records with inaccurate information (Rosenzweig, 2006; Ridge et al., 2021).
Podcasts & the Digital Humanities
Podcasts are hailed as the ideal bridge between academic scholarship and the general public because they can convey historical content through the human voice in a way that written text may not achieve (Cohen, 2018). The emergence of podcasts followed the rise of blogs, and their development alongside advances in digital technology enabled open-access scholarship (McClurken & Covart, 2022). Furthermore, podcasts are ideally suited to our mobile digital age, allowing us to explore and even create historical narratives wherever we go, no longer limited to reading on the page (McClurken & Covart, 2022).
As a sound-based medium, podcasts can create a sense of intimacy with their audience. They offer content that is informal and accessible while maintaining a level of expertise and engagement (McClurken & Covart, 2022). Further, podcasts broaden the range of voices and stories heard (McGregor & Copelan, 2022).
Projects like Ben Franklin’s World, Consolation Prize, and Through Line exemplify how digital humanities scholars can produce audio-based scholarship. These projects also demonstrate that podcasts are becoming an increasingly influential format for news and information dissemination (McClurken & Covart, 2022; Shearer et al., 2023). For example, Ben Franklin’s World episode “Slavery and Freedom in Massachusetts” showcases this intimacy. In this episode, host Kyera Singleton offers a moving account of the enslaved people at the Royall Plantation, integrating primary and secondary historical sources, including business records, newspapers, baptismal records, and archaeological evidence, to enrich the narrative.
Visual information also plays a significant role in the effectiveness of podcasts. In Ben Franklin’s World’s episode “Slavery and Freedom in Massachusetts”, descriptions of artifacts unearthed during an archaeological dig on the Royall Plantation’s slave quarters, including marbles, pipes, and earthenware, show how enslaved individuals made a life for themselves outside of their enslavers’ gaze. Additionally, “Unrecognized Citizens” of the Consolation Prize podcast effectively incorporates sources by featuring an excerpt from an interview with scholar Alice Baumgartner, who provides a vivid description of Lucien Matthews in her book, South to Freedom.
The structure of a podcast is equally essential. The “Lavender Scare” episode of the Through Line podcast does an outstanding job of organizing the story into three well-defined segments. It begins with the case study of Madeline Tress, which introduces the first segment focused on the birth of the panic. The other two segments delve into the hunt and the fall of the scare, together creating a compelling narrative supported by historical facts from a time in American history when politicians exploited the private lives of gay and lesbian citizens for political gain.
Podcasts are a natural part of the digital humanities’ evolution, as they share features with tools currently used in the field, including the production and editing of public-facing content such as digital exhibitions. The collaborative ebook platform Perusall can transform an uploaded podcast into a crowdsourcing experience, allowing users to annotate content based on specific criteria using searchable hashtags. Both digital humanities and podcasts aim to expand their audiences and enhance accessibility through searchable text. Additionally, collaborations across disciplines are common to both the digital humanities and podcasts. Ultimately, podcasts offer digital humanities researchers another avenue to engage the public with historical content.
What Can Digital Humanities Do With Crowdsourcing?
Crowdsourcing is a project design that relies on public participation in co-creating cultural heritage collections using networked digital technologies (Ridge et al., 2021). This approach can generate valuable data, increase the searchability and accessibility of materials, provide meaningful opportunities for public engagement, and allow participants to contribute to knowledge creation (Ridge et al., 2021).
This type of project design not only benefits transcribers but can also advance digital humanities projects (Shelton et al., 2024). A digital humanities project with broad historical appeal would be well-suited to crowdsourcing. Tasks ideal for crowdsourcing include transcribing historical documents with broad appeal, such as the Virginia Chronicle, WWII Separation Notices, and the By the People projects.
Project documents should be relatively easy to read and interpret and brief (not exceeding two pages). Transcription projects that a volunteer can complete in an hour are ideal for keeping volunteers engaged, as supported by a recent study by Shelton and colleagues (2024). Additionally, transcription projects that require minimal interpretation of the original text are ideal, as the readability and interpretive demands of projects, like the Bentham Project manuscripts, might challenge many volunteer transcribers.
The project interface should also be designed to be as accessible as possible for transcribers. The By the People project is a model for crowdsourcing as it is easy to access (registration is not required) and allows individuals from anywhere in the world to participate. This level of inclusiveness enables volunteer transcribers who might not have access to the Library of Congress to contribute to the creation of knowledge. Additionally, projects with user-friendly interfaces that make navigation easy are also helpful. For example, Project WWII Separation Notices features an interface with drop-down options to ease transcription, standardize entries, and reduce transcription errors.
Based on my experiences transcribing documents for the Virginia Chronicle, WWII Separation Notices, and By the People projects, and on previewing files for the Bentham Project, I have observed several key features necessary to retain participants in a crowdsourcing project. These features include easy access to the project site, clear task communication, and effective channels between transcribers and project managers.
From my experience, the projects that required minimal access barriers were the most enjoyable. The ease of accessing and navigating the project content kept me engaged with the sites longer and gave me the greatest satisfaction from the time I spent participating. This ease was noticeable in the By the People and the Virginia Chronicle projects. While the Virginia Chronicle project required registration, my registration was confirmed within seconds, giving me easy access to the transcription portal.
Project managers should clearly communicate the expected tasks of transcribers. While I could not access the Bentham Project, the manuscripts were difficult to read, and the instructions for transcribing them required an advanced understanding of Bentham’s intentions. Another feature in a crowdsourcing project that helps engage and retain participants is a way for transcribers to communicate questions and concerns to project managers. I left a note for the community managers on the Virginia Chronicle project about the interpretation of the manuscript text, which felt great because I wanted to make sure the issue was seen by someone who could make the necessary changes. The By the People participants also identified channels such as email, Twitter/X, and a moderate online discussion forum as helpful to keep them engaged (Shelton et al., 2024). Ultimately, the goal of crowdsourcing is to increase the searchability and accessibility of information and to provide opportunities for co-participants to create knowledge. We should make this process easier.
How to Read Crowdsourced Knowledge
This post examines how Wikipedia users can assess a page’s strength by analyzing its View History and Talk pages. These tools help users understand the page’s evolution and the identities and backgrounds of the editors who contributed to its development. The digital humanities Wikipedia page and screenshots from this page are used as examples.
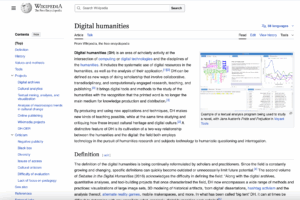
Wikipedia calls itself “the free encyclopedia,” which it is at its core. This crowdsourcing project includes tools that, by design, provide checks to the legitimacy of the site entries, including the View History and Talk pages. The View History and Talk pages of a Wikipedia entry provide users with access to the entry’s back end, enabling greater understanding of the page and the editors who shaped its development over time.
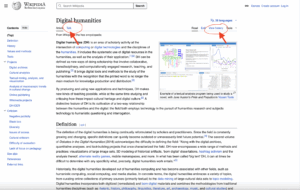
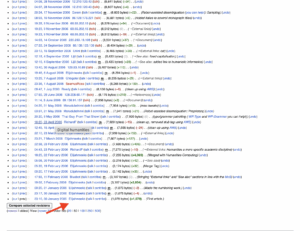
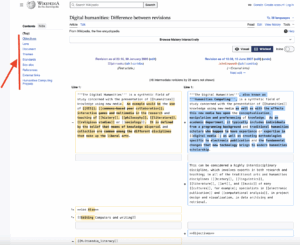
The View History page provides users with information about an entry’s origin and evolution, including its date and time of origin and its initial author and contributing editors over time. This page also provides users with access to the identity, background, and qualifications of page editors. This page also provides users with access to Page Statistics. This external tool shows patterns in edits to the entry, including the number and timing of edits, as well as editors’ activity patterns. A user can also use the Compare link within this page to view and compare entry revisions made over time.
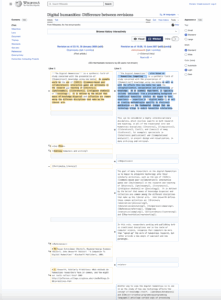
Analysis of the View History content of the Digital Humanities page reveals that this entry was posted on January 30, 2006, by user Elijahmeeks.
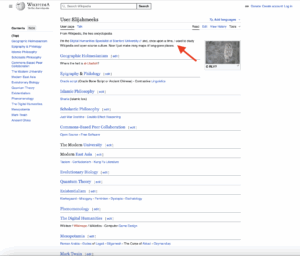
By clicking the profile link under this user’s name, we see that he is a digital humanities expert at Stanford University and studied Wikipedia and open-source culture.
The inaugural page was sparse, featuring only a brief four-line definition of Digital Humanities (DH). However, in less than two years, the page reflected significant enhancements, including a refined definition of DH, and sections on Objectives, Lens, Document, Themes, Standards, an expanded list of References, and External links. There is also a link to access Humanities Computing Projects.
These changes, and those that would follow, were made possible through crowdsourcing and input from the top dozen editors on this page, who represent a diverse range of backgrounds, experiences, and expertise in the field of digital humanities. This group includes current students, graduates, distinguished professors, a veteran Wikipedia editor, and a librarian. Contributors to this page include editors who specialize in digital culture, Wikipedia studies, and digital culture. Most importantly, these editors represent diverse viewpoints and expertise, providing them with the lens and knowledge to meaningfully contribute to the editing process of the digital humanities page.
The transparency in developing a Wikipedia entry is an integral part of the Wikipedia project. This transparency is facilitated through the Talk page, which allows users to view a page’s editing history. This feature is designed to enhance transparency and build user confidence in the information presented. The Talk page provides a forum for editors to discuss, debate, and resolve disagreements about an entry’s content, and to communicate proposed changes to an entry. Some early discussions on this page focused on differentiating digital humanities from humanities computing, which are conflated. Another topic was on the organization of the page by issues.
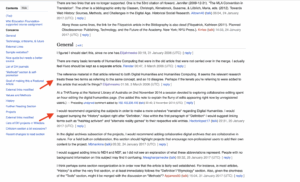
Interestingly, topics related to History and Literature generated the most controversy, while issues on computing generated the least debate. These differences might reflect the technical backgrounds and expertise of the top editors who made the most significant contributions to the page.
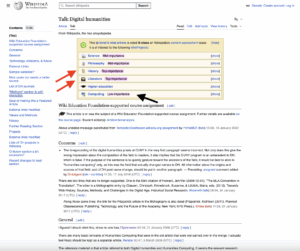
The process of deconstructing the digital humanities Wikipedia page highlights the limitless possibilities of crowdsourcing to develop open-access Wikipedia pages, particularly when contributors include editors with a range of backgrounds and expertise relevant to the topic.
Network Analysis With Gephi
Network visualization tools, algorithms, and custom-built interfaces can help visualize and analyze relationships in datasets that might otherwise be invisible, as exemplified in the Virtual Texts, Tudor Networks, and Linked Jazz projects (Arnhert & Arnhert, 2023; Cordell, 2015; Lange & Pattuelli, 2014). In the Virtual Texts project, for example, researchers used network graph tools to visualize text sharing within a dataset of 19th-century newspapers and magazines, showing how specific texts were copied and recirculated across newspapers and magazines within regions and over time.
Interactivity with these projects can also reveal network relationships between nodes and edges at individual, network, and temporal levels. The Linked Jazz project offers users robust interactivity at the individual musician level and for visualizing relationships between jazz artists and other artists (Lange & Pattuelli). The Tudor Networks project visualization allows users to see how state letters traveled across time and space and to visualize the movement of a person or institution’s communications as bursts, showing their reach. We can also see the scale of communications by the size of the symbolic circle used (Arnhert & Arnhert, 2023).
Gephi, a network analysis tool, exemplifies how network tools can extend a user’s interactions with a project and enable researchers to understand relationships between edges and nodes in datasets in new ways. Using the Gephi tool with the “Early African American Film Database, 1909-1930 dataset revealed additional capabilities with network graph tools, including the ability to visualize networks differently. Tools like the Fruchterman-Reingold algorithm can untangle network graphs and enhance their visibility by dispersing groups and creating space around larger nodes, making more densely connected parts of the network more visible. Also, tools like the modularity report highlight internal subdivisions within a network into distinguishable groups. Gephi tools, such as the Multimodal Networks Projection tool, also allow researchers to convert bimodal networks into unimodal networks, altering how links and edges connect for even greater visualization.
Mapping with Kepler.gl
Digital mapping tools utilized in digital humanities projects allow researchers to reconceptualize space and time through the convergence of technological and intellectual exploration (Presner & Shepard, 2016). Digital mapping tools can connect images and geography to produce an understanding of scale on projects using archived images with metadata. These projects can also enable scholars to develop projects focused on historical memory and community-based mapping (Arnold et al., 2020; Brennan, 2014; Regan & Gonzaba, 2021).
Kepler.gl is a powerful open-source digital mapping tool that provides researchers with robust visualizations of location-based data (Robertson, 2025). Kepler.gl’s digital maps include point, cluster, heat, time, and category maps that visualize project data using georeferenced coordinates. Analyzing records in the WPA Slave Narrative Collection dataset provided an opportunity to navigate Kepler.gl mapping tools.
The Kepler.gl point map visualized the locations in Alabama where interviewers recorded slave narratives. It is clear there were clusters around the larger, densely populated cities of Columbus, Montgomery, and Birmingham. When examining the WPA Slave Narrative Collection data in Kepler.gl using heat maps, the visualization makes the data points more pronounced by grouping points that are close together. The heat map enhances the visualization by showing cluster density across a spectrum of colors.
While the point, cluster, and heat maps provide one type of visualization of geospatial data, the time map offers another for project data. When examining the WPA Slave Narrative Collection data using the Kepler.gl time map and the field indicating when the interviews took place, it is clear that most of the interviews in this dataset occurred during the warm months, between May and August 1937.
When examining the WPA Slave Narrative Collection data using the Kepler.gl category map, the power of this visualization tool is evident in its ability to take a data field, in the case of my analysis, Type of enslaved person, to match the response to the location of the interview, and to get a more thick map description of the data set, in this case the type of work the narrator did during enslavement. Most of the responses, according to the map, indicate that the narrators did not specify the type of work performed, or that the interviewer did not record it.
While the map allows users to visualize the large number of cases that fall into this category, it does not tell us what type of work the “unknown” cases performed. The large number of cases that fit this category is, however, still interesting, as it can correct assumptions made by most people that the majority of African Americans enslaved in Southern states were field slaves.